
More technical indicators are emerging to suggest that the broad-based summer rebound in stocks might be the start of something bigger.
Over the past few trading sessions, technical analysts have confronted a number of “market breadth”-related indicators that could portend further gains.
For starters, the number of S&P 500 stocks trading above their 50-day moving averages reached 93% on Friday — the highest level since June 2020, according to Dow Jones Market Data. On Monday, the number of S&P 500 stocks closing above that level was 90.7%.
See: Why the U.S. stock rally looks more like a new bull market than a bear bounce to these analysts
This is important because in recent decades, once the number of S&P 500 stocks trading above their 50-day moving average topped 90%, the market was almost always higher one year later — usually substantially so.
On average, after reaching this market-breadth milestone, the S&P 500 has gone on to gain, on average, more than 16% over the next 12 months. However, near-term returns were somewhat more volatile.
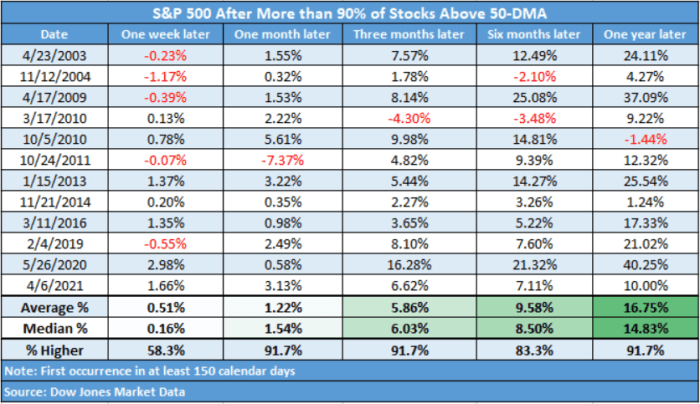
“Every major market low over the past 50 years or so has been marked by that metric exceeding the 90% threshold,” said Todd Sohn, managing director of technical strategy at Strategas.
“In the near term, your returns can be a bit of a tossup. But the returns over the next six to 12 months historically do come in above average with very strong positive hit-rates — something in the area of 80%-90% of the time,” he added.
Furthermore, market technicians also took note of the fact that the Invesco S&P 500 Equal Weight ETF RSP, +0.22% closed above its 200-day moving average on Friday for the first time since April — another sign that the stock-market rally has been encouragingly broad-based.
So-called “secondary” indicators like market breadth are important to market technicians because they enable them to look “under the hood” and glean better insights into the quality of a given market trend, said John Kosar, chief market strategist at Asbury Research.
“I focus more on these internals now because if all you’re watching is the price, then all you’re doing is chasing your tail. I want to see the quality of these moves, not just how big they are,” Kosar said.
In a research note sent to his clients Monday, Kosar noted that a number of key stocks, exchange-traded funds and indexes have all either surmounted their 200-day moving average over the past few trading days, or have come extremely close.
He cited this as another strong example of market breadth, but added that the rally in stocks has become somewhat overextended — meaning a pullback might be in store over the next few weeks.
Some of the names cited by Kosar include: Amazon.com Inc. AMZN, -0.26%, Microsoft MSFT, +0.53%, the Dow Jones Industrial Average DJIA, +0.45%, the Russell 2000 RUT, +0.23%, the Philadelphia Stock Exchange Semiconductor Index SOX, +0.31%, the SPDR Portfolio S&P 1500 Composite Stock-Market ETF SPTM, +0.40% and the Dow Jones Transportation Average DJT, -0.32%.
“All these big market-leading stocks and the averages are testing the averages at the same time,” Kosar said, adding that this is another example of the breadth of the market’s move.
Of course, strong market breadth doesn’t mean that different areas of the market are seeing equally strong returns. Since stocks hit their lows of the year in June, growth names like Amazon AMZN, -0.26%, Google parent Alphabet GOOGL, +0.33% and Netflix NFLX, -0.08% have outperformed — as have the ARK Innovation ETF ARKK, +0.35%, and cryptocurrency-linked stocks like Coinbase Global Inc. COIN, +1.64% and Microstrategy Inc. MSTR, -1.07%.
Still, the growth and value factors are solidly higher over the past month. And on Monday, the S&P 500 SPX, +0.40% and Dow Jones Industrial Average DJIA, +0.45% reached their highest closing levels since May, while the Nasdaq Composite COMP, +0.62% recorded its best close since April.
Techyrack Website stock market day trading and youtube monetization and adsense Approval
Adsense Arbitrage website traffic Get Adsense Approval Google Adsense Earnings Traffic Arbitrage YouTube Monetization YouTube Monetization, Watchtime and Subscribers Ready Monetized Autoblog
from Stock Market News – My Blog https://ift.tt/nmAtNGg
via IFTTT
No comments:
Post a Comment